Oil Trading Forecast - OPEC and Trade Wars Will Dominate Direction
GDP, TRADE WARS AND OPEC - NEWS AND TALKING POINTS
- OPEC decision will eventually weigh on the price of oil.
- Global growth may miss expectations if trade wars continue to rattle investor sentiment.
OIL PRICE LIKELY CAPPED AS GLOBAL GROWTH CONCERNS GROW
The latest OPEC meeting triggered mixed reactions with the market divided over whether the output increase would help re-balance the market and dampen prices. Friday’s near $3/bbl. jump is gradually being eroded and is currently respecting the downtrend that started at the May 22 high of $80.50/bbl. The OPEC announcement late last week remains ambiguous with the overall increase in oil production somewhere between 700,000/bbl. and 1,000,000/bbl. a day. Further clarity over the coming weeks will help usher oil prices.
However what is clear is that global growth is likely to be crimped in the near future as the trade wars and tariffs dominate the landscape. According to the IMF global growth is expected to grow by 0.1% to 3.9% in 2018, “supported by strong momentum, favorable market sentiment, accommodative financial conditions, and the domestic and international repercussions of expansionary fiscal policy in the United States. The partial recovery in commodity prices should allow conditions in commodity exporters to gradually improve.” A lot of this sentence, from the April World Economic Outlook report, now looks shaky at best.
The recent sell-off in global equity markets is perhaps a better real-time indicator of global GDP concerns with major stock markets dropping sharply from albeit record high levels.
TRADE WAR BACKGROUND ARTICLES AND PRIMERS:
US-China Trade War – A Brief History of Trade Wars From 1900 to Now
The Impact of Tariffs and Trade Wars on the US Economy and the US Dollar
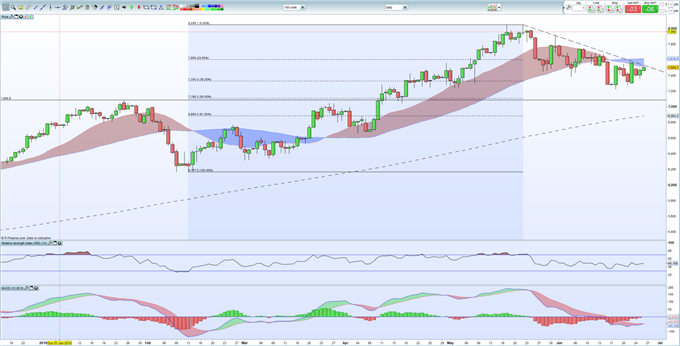
BRENT CRUDE NEARS RESISTANCE
Brent is currently trading just below the downtrend from the May 22 high and is also touching the 20-day moving average, currently at just over $75.0/bbl. If these levels are broken, Fibonacci resistance at $76.05/bbl. comes into play and may prove difficult to break. On the downside a break of $73.30/bbl. would open up $71.08/bbl. before a combination of the 200-day moving average and 61.80% Fibonacci retracement combine ajust under $69.00/bbl.
BRENT OIL DAILY PRICE CHART (DECEMBER 2017 – JUNE 26, 2018)
Start Trading with Free $30 : CLAIM NOW $30
VERIFY YOUR ACCOUNT AND GET YOUR $30 INSTANTLY ,MAKE MONEY WITHDRAW !!
IF YOU FACE ANY PROBLEM TO GET THIS OFFER PLEASE CONTACT US FOR
SUPPORT , CLICK SMS BAR ABOVE THEN TALK TO US.


Comments
Post a Comment