US Dollar Pullback Continues, EUR/USD Begins Test of Key Resistance
Talking Points:
- This week marks the final week of Q2 and the first half of 2018, and this brings the potential of Quarter-End flows across global markets. We’ve seen some rather robust trends develop in Q2, key of which has been a re-emergence of US Dollar strength after EUR/USD embarked on a notable down-trend in April that ran through May/June.
- The big question as we move into Q3 and the second-half of the year is whether that trend of Euro weakness and US Dollar strength might continue. Also of relevance is a build of pressure in the equity space after the hawkish FOMC rate decision a couple of weeks ago.
US DOLLAR PULLBACK CONTINUES AS EUR/USD RECOVERS INTO KEY RESISTANCE
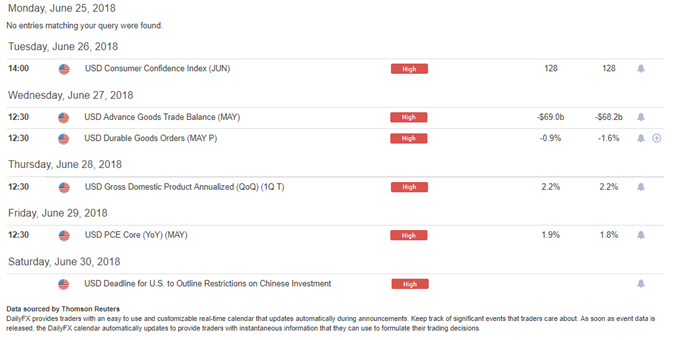
The US Dollar pullback that started last Thursday has continued into this week’s open. This is the final week of Q2, and this type of backdrop can often lend itself to profit taking from strong trends as we look to wind down the quarter. Making matters a bit more interesting is the fact that we get quite a bit of US data this week, with high-impact announcements relevant to the Dollar due to be released every day Tuesday-Friday. Also populating the headlines will likely be more volleying around tariffs and trade wars, and this will remain a relevant risk as well. Below, we’re looking at the high-impact USD items on the economic calendar for this week:
ECONOMIC CALENDAR: HIGH-IMPACT USD EVENTS FOR WEEK OF JUNE 25, 2018
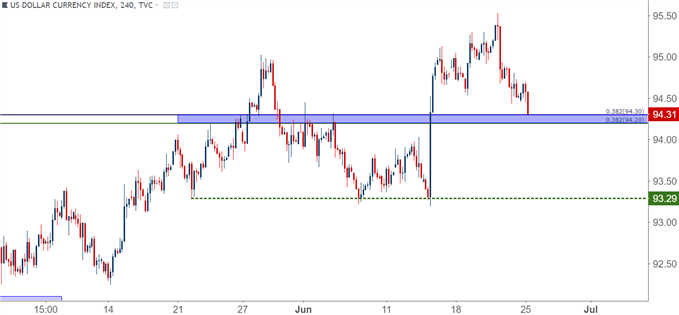
In the US Dollar, prices are approaching a key zone of prior resistance, and this could be an interesting area to watch for higher-low support potential. This area runs from 94.20-94.30 on DXY, and is comprised of two longer-term Fibonacci retracements. The price of 94.30 is the 38.2% retracement of the 2014-2017 major move, and 94.20 is the 38.2% retracement of the 2017-2018 down-trend.
When prices were rallying to fresh highs last month, prices caught a bit of resistance in this zone, and we haven’t yet seen this prior area of resistance show as fresh support.
US DOLLAR VIA ‘DXY’ FOUR-HOUR CHART: PULLBACK TO FIBONACCI SUPPORT/PRIOR RESISTANCE
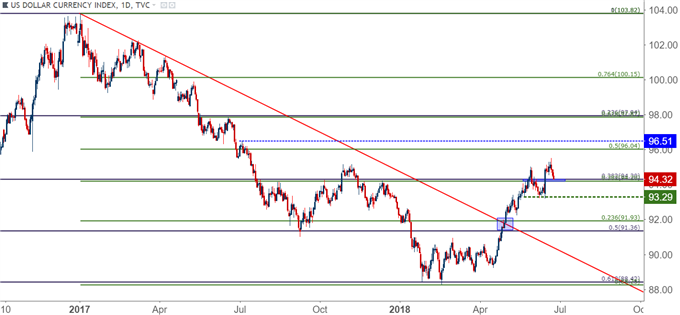
As we look to wind down Q2, that longer-term bullish structure in the US Dollar remains. As we came into Q2, the currency was holding on to the prior year’s down-trend that had seen 61.8% taken-out from the 2014-2017 bullish move. But after catching a bid in late-April and continuing to run higher through the month of May, the US Dollar set a fresh 11-month high in June and the prospect of bullish continuation remains attractive as we move into the second half of the year.
US DOLLAR VIA ‘DXY’ DAILY CHART: PULLBACK FROM 11-MONTH HIGHS
EUR/USD BEGINS TEST OF KEY RESISTANCE ZONE
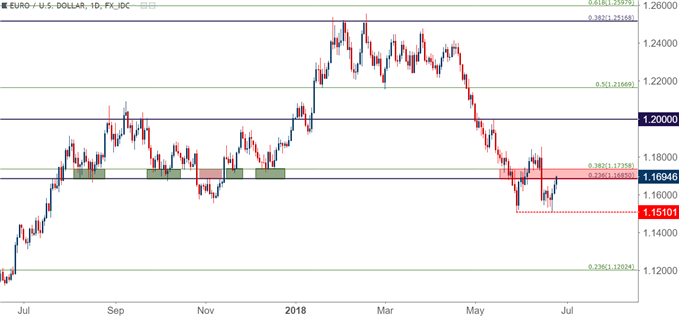
Going along with that US Dollar test of support is a resistance test in EUR/USD. We looked at the pair in our webinar last week remarking that the current setup had the potential to be a bear trap. After a failed attempt at taking out the 11-month low last week, prices have jumped-higher and are now testing an area of prior support. The zone that runs from 1.1685-1.1736 had helped to provide support on multiple occasions in the latter-third of last year, and each of those prices are taken from longer-term Fibonacci studies. The price of 1.1685 is the 23.6% retracement of the 2008-2017 major move, while the level of 1.1736 is the 38.2% retracement of the 2014-2017 major move.
EUR/USD DAILY CHART
On the data front, the latter portion of this week brings some interesting Euro drivers to the fray. German CPI is due on Thursday morning, and this is followed by German unemployment and Euro-Zone CPI set to be released on Friday.
DAILYFX ECONOMIC CALENDAR: HIGH-IMPACT EURO DATA FOR THE WEEK OF JUNE 25, 2018
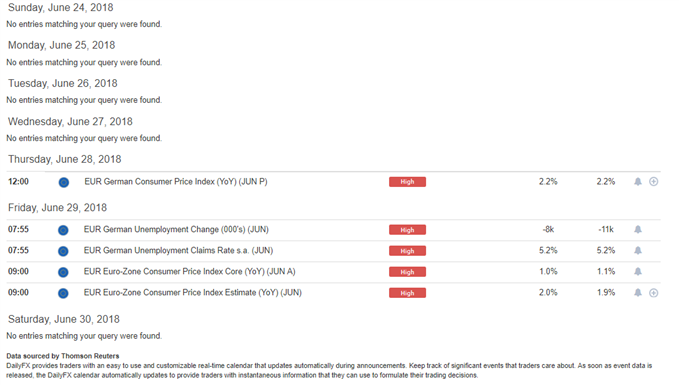
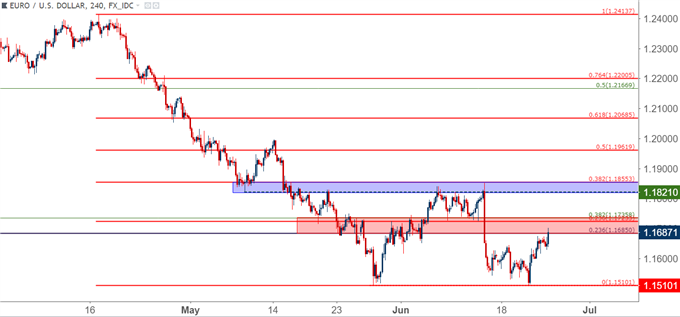
As we trade into the second half of 2018, the big question around EUR/USD is whether the pair can hold on to the recently-established down-trend. The prior swing-high comes in around 1.1855, and as long as prices remain below this level, the door remains open for bearish continuation. Particularly interesting would be if sellers begin to respond while within the current zone. This would present a setup with which traders can look at stops above that prior area of resistance, targeting a re-test of the 1.1510 low. Interestingly, that prior swing-high of 1.1855 comes-in right around the 38.2% Fibonacci retracement of the Q2 sell-off, and the 23.6% retracement is within our confluent zone at 1.1723.
EUR/USD FOUR-HOUR CHART: BEARISH CONTINUATION POTENTIAL
WILL US STOCKS CATCH A BID AS END OF Q2 NEARS?
Also of interest as we wind down Q2 is the question of whether strength returns in US stocks. The Dow Jones has had a particularly difficult time since the Fed’s rate hike two weeks ago. We had looked at a short-side setup off of Fibonacci resistance just ahead of that Fed meeting, and that led into a consistent streak of losses in the Dow, with support finally starting to show last Friday. But as US futures markets have started to price this week, prices have moved deeper within that support zone, and that bullish response from last Friday has yet to show-up today.
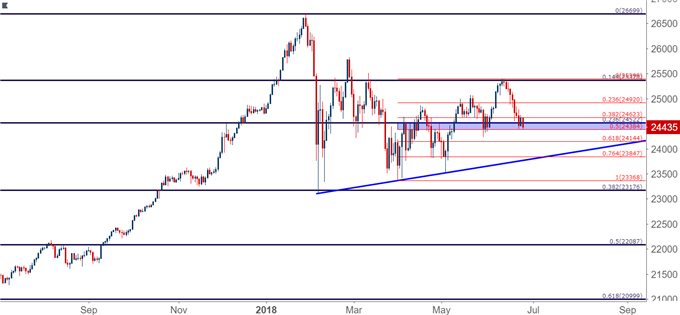
At this stage, the Dow is finding a bit of support around the 50% retracement of the April-June bullish run, and this is confluent with the 23.6% retracement of the post-Election move. If we’re unable to hold above that 50% retracement at 24,384, the door is opened for a test of the 61.8% retracement at 24,144, at which point we’ll have a re-test of the bullish trend-line taken from the February, April and May swing lows.
DOW JONES DAILY CHART: PRICES TESTING CONFLUENT SUPPORT AFTER LAST WEEK’S SELL-OFF
S&P 500 FINDS SUPPORT AT PRIOR RANGE RESISTANCE
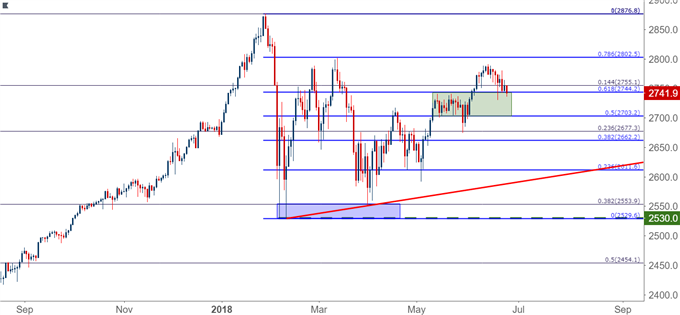
We have a similar setup in the S&P 500 with support showing around a key Fibonacci level. In the S&P, support is coming-in from the 61.8% retracement of the February sell-off, and this is showing around prior range resistance from the month of May. This keeps a bullish bias on the index as we move towards the close of Q2, and this exposes the fact that we have deeper support potential around the 50% retracement that comes in around 2700, which had previously helped to set range support.
S&P 500 DAILY CHART: SUPPORT AT PRIOR RANGE RESISTANCE, 61.8% RETRACEMENT OF FEB SELL-OFF
Start Trading with Free $30 : CLAIM NOW $30
VERIFY YOUR ACCOUNT AND GET YOUR $30 INSTANTLY ,MAKE MONEY WITHDRAW !!
IF YOU FACE ANY PROBLEM TO GET THIS OFFER PLEASE CONTACT US FOR
SUPPORT , CLICK SMS BAR ABOVE THEN TALK TO US.


Comments
Post a Comment