Dow Digs into Support, But Will Bulls Respond?
Dow Jones Talking Points:
- US equities are continuing to pullback after establishing fresh highs just last week. The ‘s2’ support zone we looked at last Thursday has come into play, helping to form support yesterday and again this morning. But – resistance is playing off of the ‘s1’ zone that we had previously looked at, and the inability of bulls to push up to fresh highs after this visit to support opens the door for a deeper retracement before the longer-term bullish trend might be ready to continue.
- With pullbacks showing across the Dow, the S&P 500 and the Nasdaq 100, traders can see an uneven distribution of this negative price action, with the Nasdaq holding very near highs while the S&P has pulled back a bit deeper, yet still more shallow than the move seen thus far in the Dow Jones. This alludes to the fact that we’re likely seeing a pullback in the bullish trend as opposed to a theme carrying bearish reversal potential.
DOW JONES TESTS SUPPORT ZONE: WiLL BULLS RESPOND?
US equities are continuing to pullback, and this now marks a week of bearish price actionin the Dow Jones after a fresh five-month high was set just last Tuesday. On Thursday, we looked at two areas of potential support, each of which has come into play in different ways over the past few trading days. The first area of potential support didn’t really show much for support at all, but has since come back into play as short-term resistance. The second zone of support potential has come into play now two different times over the past 24 hours.
DOW JONES HOURLY PRICE CHART: ATTEMPTING TO CARVE OUT SUPPORT
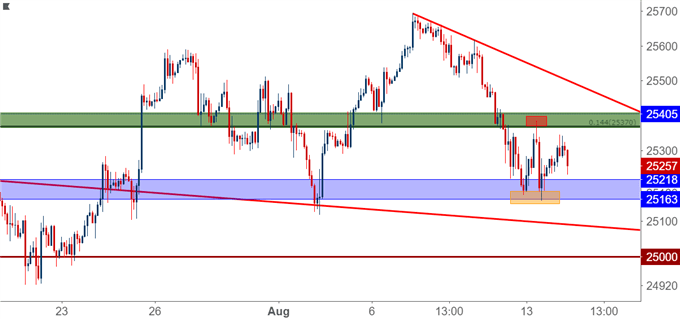
At this stage, the longer-term bullish trend remains intact after what’s become a very strong first half of Q3. Prices broke out in mid-July and that strength held all the way into last week. Last week did bring a couple of interesting drivers, key of which was a rather aggressive topside breakout in the US Dollar ahead of the release of July inflation numbers.
DOW JONES DAILY PRICE CHART
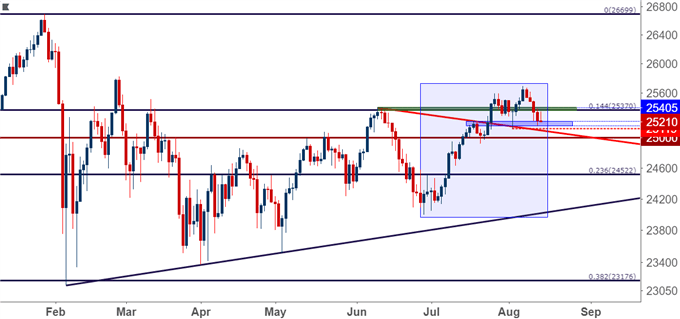
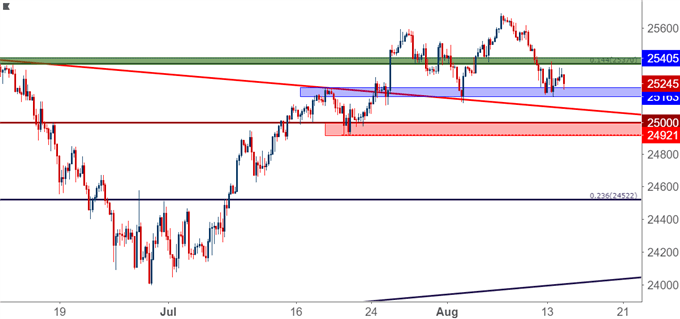
The big question at this point is one of continuation: Will bulls be able to push back-up to fresh highs after continued tests of this higher-low support zone? If this area does not hold, there is another area of interest that can keep the door open for bullish strategies, and this comes-in around the 25,000 psychological level that helped to set a swing high in the month of May, followed by some follow-thru support in early-July.
DOW JONES FOUR-HOUR PRICE CHART: DEEPER SUPPORT POTENTIAL KEEPS DOOR OPEN FOR TOPSIDE
Start Trading with Free $30 : CLAIM NOW $30
VERIFY YOUR ACCOUNT AND GET YOUR $30 INSTANTLY ,MAKE MONEY WITHDRAW !!
IT IS POSSIBLE TO SHIFT FROM $30 TO $1,000,000 TRY TODAY
IF YOU FACE ANY PROBLEM TO GET THIS OFFER PLEASE CONTACT US FOR
SUPPORT , CLICK SMS BAR ABOVE THEN TALK TO US.


Comments
Post a Comment