Dow Drops to Support After FOMC-Fueled Pullback
Talking Points:
- The Dow Jones Industrial Average has pulled back from the July breakout, and the lower-lows and lower-highs we were looking at on shorter-term charts continues to show. Prices have run into a key area of support, but with NFP on the docket for tomorrow – the big question is whether this support will be able to stem the recent declines.
- The Fed mentioned the word ‘strong’ multiple times in yesterday’s statement, and this alludes to a continued hawkish stance at the Central Bank. Thus far, US Stocks have continued to run-higher despite the Fed being the outlier amongst developed Central Banks in continuing to push hawkish policy. Will the continued strength in the US economy become a hindrance to the topside advance in US stocks? Tomorrow brings Non-Farm Payrolls for a more recent look at the employment picture, and next Friday brings CPI for the month of July for more data on the inflation front.
STOCKS DROP AFTER NO-CHANGE FOMC
US stocks are opening lower on the day, and this comes after weakness showed in futures markets throughout the Asian and European sessions. This is digesting yesterday’s FOMC rate decision, which brought very little by way of new information, but did see the bank note the strength in the US economy multiple times. This appears to keep the Fed on track with their rate hike plans in 2018, and this may even lead to a hawkish Fed next year that produces even more rate hikes. This is helping to pull prices lower across US indices, and the Dow Jones Industrial Average is now testing around the zone of support that we were looking at earlier in the week.
DOW JONES CFD HOURLY CHART: DROP AFTER FOMC INTO TREND-LINE SUPPORT
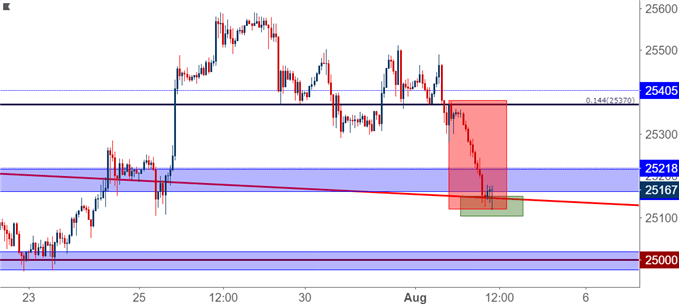
Current support for the Dow appears to be showing around a trend-line projection that can be found by connecting the June swing-high to the July 18th swing high. For those looking at aggressive bullish setups in the index, this can be a usable area to plot for short-term topside reversals.
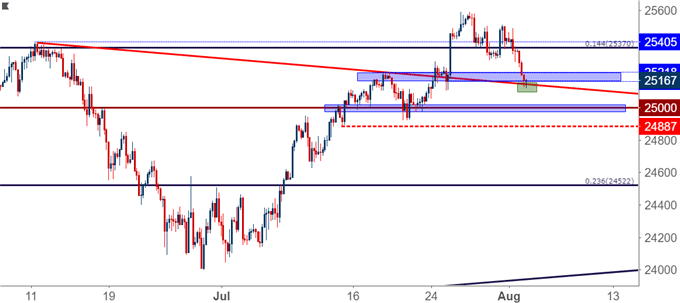
DOW JONES FOUR-HOUR PRICE CHART: SUPPORT AT PRIOR RESISTANCE TREND-LINE
NFP TO KEEP STOCKS IN PLAY
We’re not yet out of the woods on the data-front for this week, as tomorrow brings the release of July Non-Farm Payrolls out of the United States. As usual, the details of the report will be of importance as market participants look for early clues of continued strength in the US economy, and given the overnight reaction that was seen in US bourses following yesterday’s FOMC rate statement, one could surmise that signs of continued strength above market expectations could drive a deeper pullback in the index.
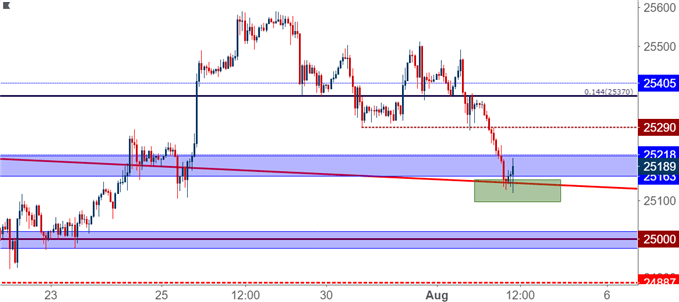
As we looked at on Tuesday, price action has started to put in lower-lows and lower-highs in the Dow since the bullish breakout that held through most of July. With yesterday/last night’s drop combined with a really big driver on the calendar for tomorrow, traders not utilizing aggressive approaches would likely want to wait for a more confirmed sign of support before looking to take the move-higher. This could also be accomplished by prices getting back into that rhythm of higher-highs and higher-lows, which does not yet exist on the hourly chart of the Dow Jones.
DOW JONES HOURLY PRICE CHART: SUPPORT HOLDS BUT LOWER-LOWS, HIGHS REMAIN
Start Trading with Free $30 : CLAIM NOW $30
VERIFY YOUR ACCOUNT AND GET YOUR $30 INSTANTLY ,MAKE MONEY WITHDRAW !!
IT IS POSSIBLE TO SHIFT FROM $30 TO $1,000,000 TRY TODAY
IF YOU FACE ANY PROBLEM TO GET THIS OFFER PLEASE CONTACT US FOR
SUPPORT , CLICK SMS BAR ABOVE THEN TALK TO US.


Comments
Post a Comment