Dow Jones Extends Support Bounce From 25k: Is the Retracement Complete?
Talking Points:
- US stocks have gotten back to their bullish ways after the FOMC-fueled pullback from last week. The S&P 500 is making a fast approach at testing all-time-highs, and the Nasdaq 100 is nearing the same high watermark. The Dow Jones, however, appears a bit more calm and remains below prior swing-highs in February. This highlights the fact that momentum or breakout strategies in US stocks may be better suited elsewhere, while the Dow remains attractive for trend-strategies looking to play pullbacks for bullish continuation.
- This week’s big item on the economic calendar is Friday’s release of US inflation numbers for the month of July.
- DailyFX Forecasts are available from the DailyFX Trading Guides page. If you’re looking to improve your trading approach, check out Traits of Successful Traders. And if you’re looking for an introductory primer to the Forex market, check out our New to FX Guide.
DOW JONES TO FRESH FIVE-MONTH HIGHS AFTER FOMC-FUELED PULLBACK
Bulls have come back into US equities over the past few trading days, helping to reverse a pullback that had started to show as we closed off what had become a very strong month of July. With the Nasdaq 100 poised to soon test all-time-highs, along with the S&P 500 making a strong push towards the same, the Dow Jones Industrial Average appears a bit more calm and has yet to test the February 27th swing high. Given the relative lack of excitement in price action around the Dow Jones Industrial Average, traders would likely want to try to avoid chasing the move here, instead steering breakout and bullish momentum strategies towards the Nasdaq 100 or the S&P.
In the Dow Jones, however, pullbacks can remain attractive for bullish continuation, similar to what we had looked at last Thursday. and prices in the Dow broke down to a short-term support area that helped to establish the low. The area of support that we had identified was taken from the projection of a prior resistance trend-line and, as we advised, this would likely be attractive for those looking to implement aggressive strategies on the index.
DOW JONES DAILY PRICE CHART
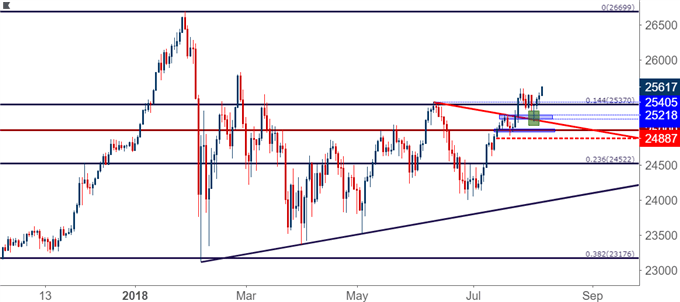
Higher-Low Support Potential in the Dow
With the Dow now trading at fresh five-month highs, the attractive route would be to catch higher-low support for strategies of bullish continuation. Such a zone may exist around the 14.4% Fibonacci retracement of the post-Election run in the Dow, and this is a level that had previously helped to set resistance with swing highs in February, March and then again in June. This area from the June high around 25,405 can be connected down to that Fibonacci level at 25,370 to create a potential higher-low support zone, and this could keep the door open for stops below the 25,290 swing-low.
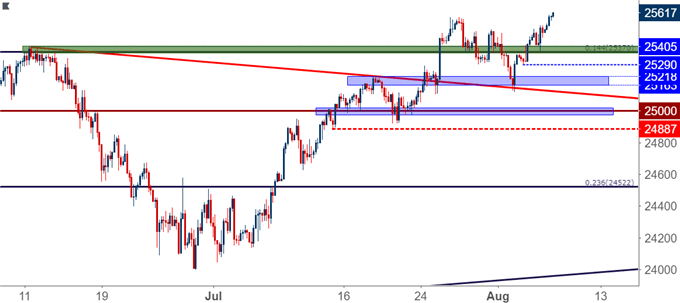
DOW JONES FOUR-HOUR PRICE CHART
Start Trading with Free $30 : CLAIM NOW $30
VERIFY YOUR ACCOUNT AND GET YOUR $30 INSTANTLY ,MAKE MONEY WITHDRAW !!
IT IS POSSIBLE TO SHIFT FROM $30 TO $1,000,000 TRY TODAY
IF YOU FACE ANY PROBLEM TO GET THIS OFFER PLEASE CONTACT US FOR
SUPPORT , CLICK SMS BAR ABOVE THEN TALK TO US


Comments
Post a Comment