DXY Index Slumps to Four-Week Low as EUR/USD Retakes 1.17
Talking Points:
- After yesterday's announcement of a potential US-Mexico trade agreement, market participants are hopeful that a US-led global trade war will be avoided.
- The DXY Index is down for its third day in a row and its eighth out of the past nine overall.
The US Dollar (via the DXY Index) is on pace for its third consecutive day of losses and its eight down day over the past nine session as global risk appetite continues to improve following the announcement of a potential US-Mexico trade agreement yesterday.
Higher yielding currencies and risk correlated assets are performing well this morning, with both the US Nasdaq 100 and S&P 500 indexes set to open at all-time highs. We're still seing an unwind of the early-August grab for US Dollars - provoked by a surge in demand for liquidity emanating from the turmoil in emerging markets - as market participants are proving hopeful with their newfound belief that a global trade war, led by the United States, will ultimately be avoided.
Losses by the greenback have helped fuel recoveries across the major currencies, with EUR/USD rising back above 1.1700 for the first time since July 31; the pair has rallied every day but one since August 14. This week's trading environment for EUR/USD will continue to be one dominated by reactions to the news wire rather than data releases on the calendar.
Elsewhere, despite mixed headlines regarding Bank of England Governor Carney's tenure through the Brexit period, GBP/USD is up for a third consecutive day as well, on pace to have posted gains in eight of its nine sessions too. It's possible that Governor Carney's position at the helm of the BOE becomes a point of contention between the soft and hard Brexit wings of the Tory Party, so it seems that this story is only just unfolding.
DXY Index Price Chart: Daily Timeframe (June 2017 to August 2018) (Chart 1)
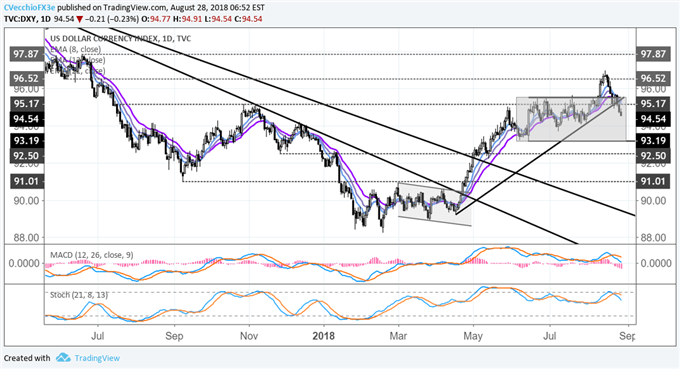
Overall, the false breakout scenario discussed last week seems to be playing out for the DXY Index . At the time we wrote, "A false breakout scenario would be underway should the DXY Index close back below 95.53, the June 21 bearish daily key reversal and June 27 to 29 evening doji star candle cluster highs."
Price remains below its daily 8-, 13-, and 21-EMA envelope, while both daily MACD and Slow Stochastics continue to trend lower (with the former close to issuing a sell signal). Further losses should be anticipated until the July 26 bullish outside engulfing bar low is reached near 94.08; such a move would be commensurate with EUR/USD rallying up past 1.1740 in the coming sessions.

VERIFY YOUR ACCOUNT AND GET YOUR $30 INSTANTLY ,MAKE MONEY WITHDRAW !!
IT IS POSSIBLE TO SHIFT FROM $30 TO $1,000,000 TRY TODAY
IF YOU FACE ANY PROBLEM TO GET THIS OFFER PLEASE CONTACT US FOR
SUPPORT , CLICK SMS BAR ABOVE THEN TALK TO US


Comments
Post a Comment