EUR/USD Forex Parabolic Wedge Sell Climax And Minor Trend Reversal

EURUSD Forex Parabolic Wedge Sell
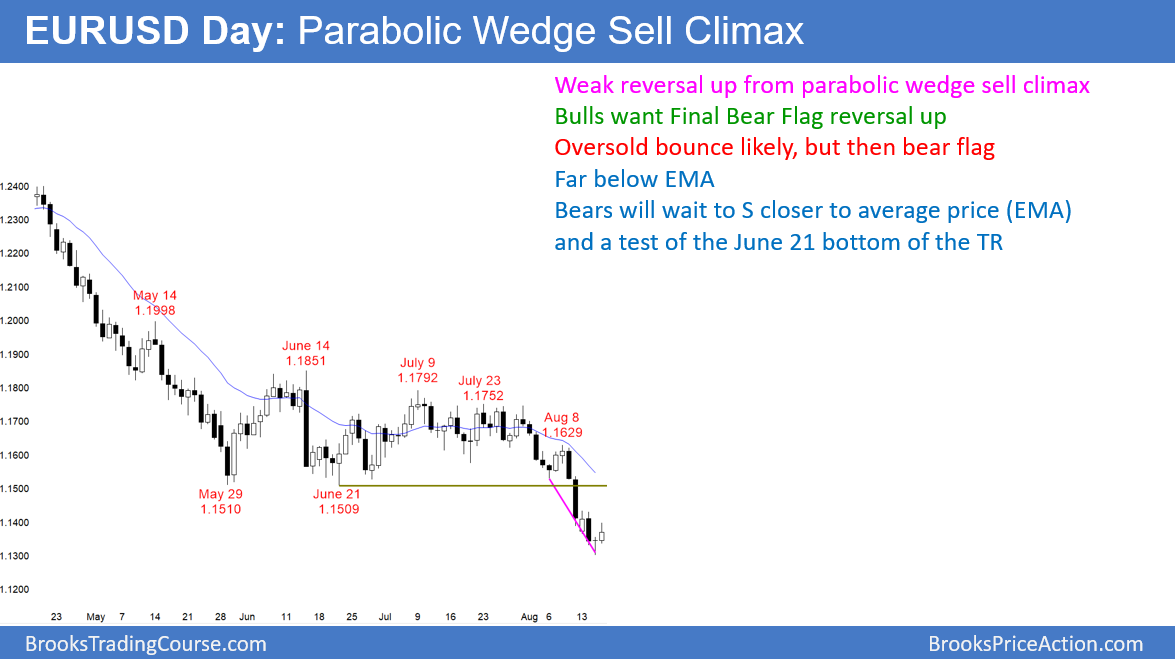
The EUR/USD daily Forex chart reversed up yesterday after a parabolic wedge sell climax. Since yesterday was a doji, it is a weak buy signal bar after a strong bear breakout. Today so far is a small reversal bar for the bulls. This is probably going to be a minor reversal.
The EUR/USD daily Forex market fell over the past 3 weeks in a parabolic wedge sell climax to far below its 20 day EMA. The bears are taking some windfall profits and will look to sell closer to the average price.
The 3 month trading range was late in a bear trend. It therefore will probably be the Final Bear Flag. This means that the breakout will likely reverse up for several months back into that trading range. However, there is no clear bottom yet.
Yesterday was a doji, which is a weak buy signal bar. In addition, the momentum down is strong. Finally, there is room to the 1.12 measured move target below. Therefore, any rally over the next 2 weeks will more likely be a test of the breakout point at 1.15 and the EMA than a major reversal. The odds favor lower prices.
The bear trend could resume tomorrow because today might form a small double top bear flag with Monday’s high. More likely, the daily chart will continue the 4 day trading range for at least several more days. It probably will soon rally 150 – 200 pips up to resistance before resuming down.
Weekly chart forming minor reversal
The weekly chart is forming a minor reversal. However, after 3 big bear bars, the odds favor at least one more small leg down to the measured move target. Therefore, if there is a reversal up next week, it will probably only last 1 – 3 weeks. The bulls need several consecutive strong trend bars on the weekly chart to reverse the selloff. That is unlikely without at least a micro double bottom.
Overnight EUR/USD Forex trading
The EUR/USD 5 minute Forex chart rallied 100 pips above yesterday’s low. The top of the most recent sell climax is Monday’s high, which is just below 1.1450. That is the magnet above. Since the daily chart fell in a parabolic wedge, the odds favor at least 2 legs up on the 5 minute chart. Therefore, day traders will look to buy a 50% selloff from the 2 day rally.
The bears know that the 4 week tight bear channel on the daily chart is unlikely to reverse into a bull trend without at least a small double bottom. They therefore will bet that this 2 day rally is a minor reversal. Since they expect a test down, they will sell rallies to resistance. Consequently, they will look to sell a 2nd leg up to around 1.1450 over the next couple of days.
Because a sell climax usually leads to a trading range, the bears will be quicker to take profits. For day traders, that means swing trades up and down will be 30 – 50 pips.
Since the chart is probably going to go sideways for several days, there will be lots of scalping opportunities up and down.
Start Trading with Free $30 : CLAIM NOW $30
VERIFY YOUR ACCOUNT AND GET YOUR $30 INSTANTLY ,MAKE MONEY WITHDRAW !!
IT IS POSSIBLE TO SHIFT FROM $30 TO $1,000,000 TRY TODAY
IF YOU FACE ANY PROBLEM TO GET THIS OFFER PLEASE CONTACT US FOR

Comments
Post a Comment