GBP/USD: Cable Bulls Extend Bounce from Fibonacci Support
Talking Points:
- The British Pound continues to recover from the earlier-month sell-off, with GBP/USD prices continuing the bounce from a key area of Fibonacci support at 1.2671. While sellers came back in off of resistance last week, the move-lower was short-lived as buyers came back in around the 1.2800 handle, which marks 50% of the bullish move. Will bulls be able to continue the drive back up to 1.3000?
- This week is rather quiet on the UK data front, but the bigger driver behind GBP/USD will likely emanate from US Dollar trends. The Greenback is testing below a big area of support, and the prospect of a bigger-picture bearish move is now appearing more likely. This could continue to lift GBP/USD, and if we do see a topside break back-above the area of resistance around 1.3000, the door could soon re-open to bullish strategies in the pair.
GBP/USD CONTINUES BOUNCE FROM FIBONACCI SUPPORT
The British Pound is trading higher so far on the fresh week, gaining against most major currencies with the notable exception being the Euro as the single currency continues to claw back earlier-month losses. In GBP/USD, prices began to bounce from a key Fibonacci support level two weeks ago at 1.2671, as this is the 23.6% retracement of the ‘Brexit move’ in the pair. As we looked at last week, that longer-term support combined with oversold readings on both Daily and Weekly price charts opened the door for a counter-trend move. We looked for resistance in the zone that runs from 1.2918-1.2956, and that zone helped to mark the highs for last week.
GBP/USD TWO-HOUR PRICE CHART
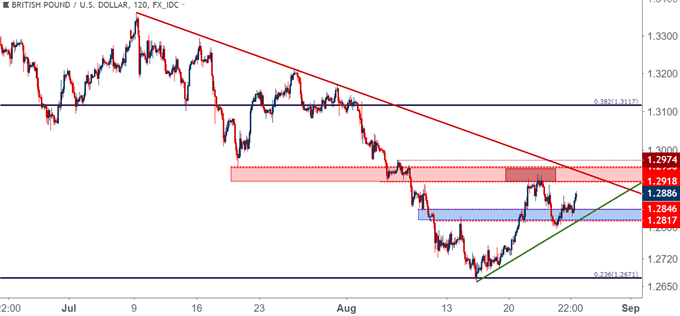
While sellers came back into the pair last Thursday to push prices off of resistance, the downside run did not last for long, as support simply showed up again around the 1.2800 level, which syncs well with the 50% marker of that bullish move. Since then, a deeper retreat in the US Dollar has helped GBP/USD to re-ascend back towards 1.2900, giving rise to the potential for a deeper bullish move as the US Dollar sell-off tests through August support.
GBP/USD HOURLY PRICE CHART
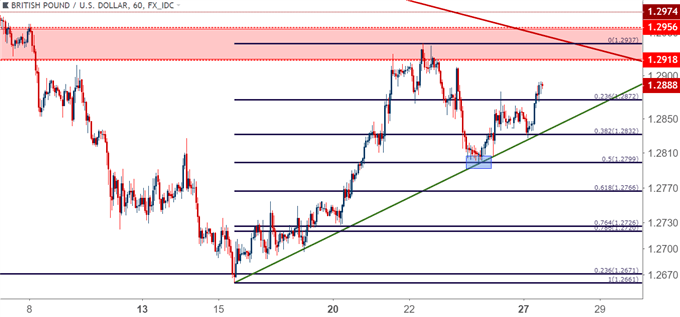
The longer-term trend in GBP/USD retains bearish qualities, as the bounce from deep oversold levels continues to hold below prior bearish structure of lower-lows and highs. As such, in this week’s FX Setups for the Week of August 27th, we looked at bearish strategies in the pair. But, as we pointed out, a bearish pattern in the US Dollar could soon open the door for additional topside in EUR/USD and GBP/USD, and if we break back-above the 1.3000 area in GBP/USD, that would be the probable scenario to work with.
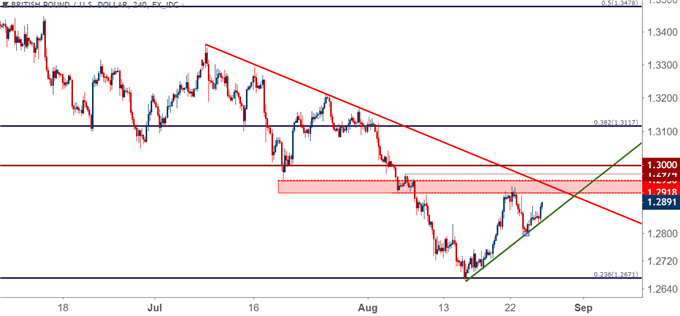
But this is setting the stage for a re-test of last week’s resistance around the 1.2918-1.2956 zone, which is now confluent with the bearish trend-line as taken from the July highs in the pair. Prices finding resistance below last week’s high keeps the door open for bearish continuation. If we budge above that high and test above the bearish trend-line, traders would likely want to wait for clarity, and if the move does continue on beyond resistance; the door could soon open to bullish strategies in GBP/USD.
GBP/USD FOUR-HOUR PRICE CHART
VERIFY YOUR ACCOUNT AND GET YOUR $30 INSTANTLY ,MAKE MONEY WITHDRAW !!
IT IS POSSIBLE TO SHIFT FROM $30 TO $1,000,000 TRY TODAY
IF YOU FACE ANY PROBLEM TO GET THIS OFFER PLEASE CONTACT US FOR
SUPPORT , CLICK SMS BAR ABOVE THEN TALK TO US


Comments
Post a Comment