Gold Price Analysis: Risk-Reward Favours Large Bullish Reversal
Gold Price Analysis and Talking Points:
- Gold Failing to Receive a Much-Needed Boost
- Chinese Intervention on Yuan Slide Signals Reversal in Gold
- Gold Speculators Positioning Raises Prospect of Bullish Reversal
GOLD FAILING TO RECEIVE A MUCH-NEEDED BOOST
Gold prices have continued to remain on the backfoot amid the gains in the USD, which has received a boost from the pickup in US yields as the Federal Reserve looks to hike another two times this year. Marginal USD rise this morning has pushed the precious metal lower by 0.2% this morning. Alongside this, key technical resistance in the form of the descending trendline from the June 14th peak remains prominent. Eyes will be on a breakout with the RSI indicator sitting on the cusp of oversold territory, raising the risk of a reversal in the near term.
CHINESE INTERVENTION ON YUAN SLIDE SIGNALS REVERSAL IN GOLD
Over the past couple of months, the correlation between the Yuan and gold has seen a notable increase in the wake of the escalating trade spat between the US-China. Consequently, the slide in the Yuan has also coincided with the fall in gold prices. However, on Friday, the PBoC had finally intervened to curb the depreciation in the Yuan by raising the reserve requirement on FX forwards trading to 20%, which makes it more expensive to hold CNH short positions. In turn, this may signal that prices in gold have bottomed provided this policy action leads to an effective cap in the USDCNH rise.
CORRELATION BETWEEN YUAN AND GOLD
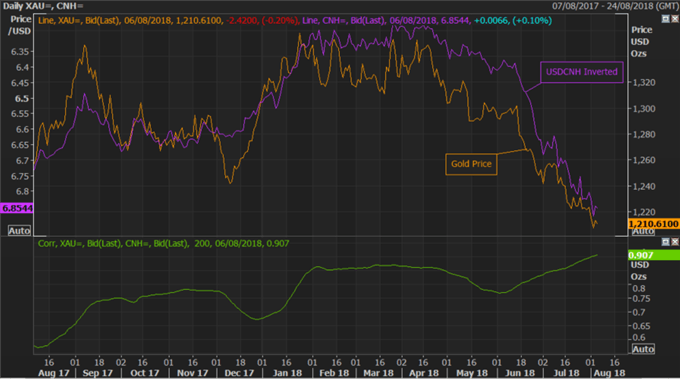
Source: Thomson Reuters
GOLD SPECULATORS POSITIONING RAISES PROSPECT OF BULLISH REVERSAL
According to the latest CFTC data, hedge funds and money managers added 5k contracts to their net short position, making it the largest net short since 2006. This also surpasses the extreme short positioning seen at the backend of 2015, which later saw a $300/oz surge in the price over the following 7-months. Given the record short positioning in gold, this suggests that the precious metal is very close to a bottom and may be ripe for a reversal.
GOLD PRICE CHART: DAILY TIME-FRAME (FEBRUARY-AUGUST 2018)
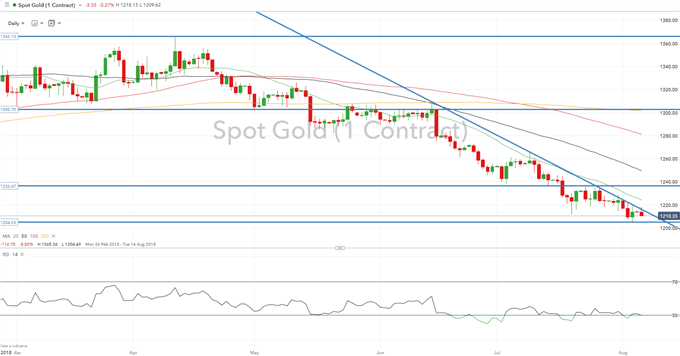
Given that the price of gold has fallen near 11% since its peak in April, risk-reward is most definitely on the upside. While record net-short position provides us with a good indicator that we are on the verge of a break to the upside, it does not however, provide us with a good signal that the near term bottom has been reached. $1200/oz remains to be key support for the precious metal, while RSI indicators dipping in oversold terrirtory suggests the $1200 level may continue to hold for now.
GOLD TECHNICAL LEVELS
S1: $1204 (July 2017 Low)
S2: $1200
R1: $1215(Descending trendline from June)
R2: $1236
R3: $1250

Start Trading with Free $30 : CLAIM NOW $30
VERIFY YOUR ACCOUNT AND GET YOUR $30 INSTANTLY ,MAKE MONEY WITHDRAW !!
IT IS POSSIBLE TO SHIFT FROM $30 TO $1,000,000 TRY TODAY
IF YOU FACE ANY PROBLEM TO GET THIS OFFER PLEASE CONTACT US FOR
SUPPORT , CLICK SMS BAR ABOVE THEN TALK TO US.


Comments
Post a Comment