US Dollar Bounces as EUR/USD Tests Key Resistance
The US Dollar is bouncing from the August lows that printed with yesterday’s price action, and this comes along with a downside move in EUR/USD from a key area of resistance. This sets the stage for two possible outcomes as setups exist for both EUR/USD bulls and bears. For bullish EUR/USD scenarios, traders can look to shorter-term themes with possible higher-low support at prior short-term resistance. On the bearish side of the pair, traders can look at the longer-term trend after an oversold theme bounced up to a key area of chart resistance, taken from the July highs.
- The remainder of this week’s economic calendar has items of interest out of Europe, Canada and the US. Tomorrow brings German inflation and unemployment numbers to go along with Canadian GDP and the most recent print of the Fed’s preferred inflation gauge of PCE. Friday closes the week with inflation numbers out of the Euro-Zone, and this will likely keep the single currency on the move as we close out what’s become a very active month of August.
US DOLLAR BOUNCES AS EUR/USD DROPS FROM RESISTANCE
The bullish two-week jump in EUR/USD has started to pullback after setting a fresh August high yesterday. This comes on the heels of another two week-trend that started the month by pushing the single currency lower, largely on the basis of fears around the still-developing situation in Turkey. As Turkish markets came back online after being on holiday last week, Lira weakness has started to show again and the Euro has started to give back some of the prior bullish move. This is coupled with another Euro-negative theme of volatility in Italian politics, as a news report earlier this morning indicates that the Italian government is going to request that the ECB do another round of QE to help support Italian bond prices. While that seems an unlikely scenario – it does speak to the fear that market participants showed in the month of May as the current administration was taking seat in Rome.
In response, EUR/USD is dropping from the second resistance area we looked at coming into this week. This runs from the Fibonacci level of 1.1709 up to the psychological level of 1.1750, comprising a zone of resistance that held the highs in the pair through the second half of July.
EUR/USD
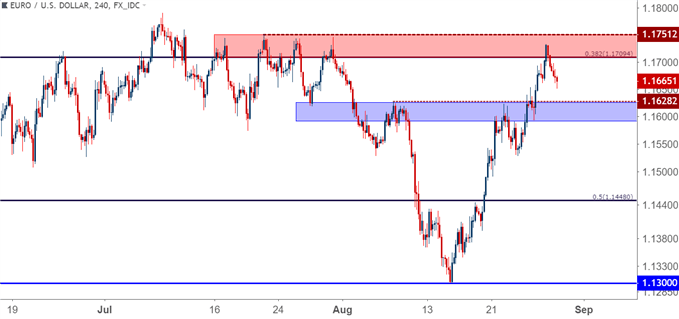
The big question at this point is one of directional continuation, as a case can be made on either side of EUR/USD at the moment. On the long side, traders can look for support to show at prior resistance before looking to trade the move higher. This would be the shorter-term approach, using four-hour and hourly charts to plot for higher-low support in a move of bullish continuation. Focus remains on resistance up to 1.1750, as a topside break will further open the door to themes of longer-term bullish continuation in the pair.
EUR/USD FOUR-HOUR PRICE CHART: SUPPORT POTENTIAL AROUND PRIOR RESISTANCE
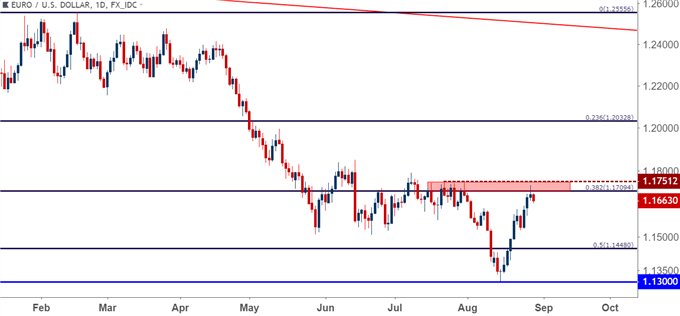
And on the short-side of EUR/USD, the trader would be looking for the longer-term trend to remain in play after prices in the pair tested a lower-high element of resistance at a key area on the chart.
EUR/USD DAILY PRICE CHART: HOLD OF RESISTANCE, RE-EMERGENCE OF BEARS KEEPS DOOR OPEN FOR LONGER-TERM BEARISH CONTINUATION
US DOLLAR BOUNCE FROM SUPPORT UNDER REVIEW
The US Dollar has been rather volatile, particularly for summer price action as the four-month bullish trend in the pair came under fire over the past two weeks. Perhaps most interesting, support seemingly could not hold the declines, as sellers continued to pushthrough a number of key levels in the second-half of August. As we mentioned in yesterday’s webinar, that USD-weakness appeared to be unevenly distributed, showing quite prominently against the Euro while other pairs retained the longer-term theme of US Dollar strength.
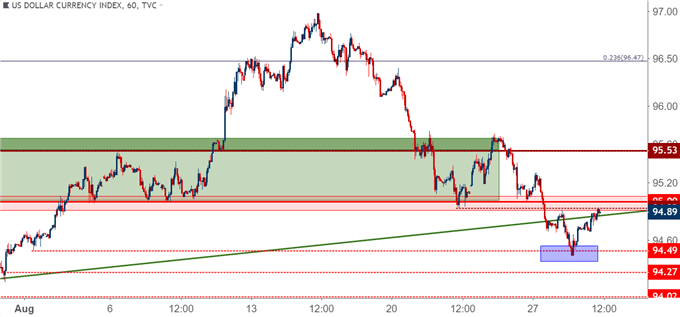
At this point, the US Dollar has bounced up prior support, and a bit of selling pressure has started to show. This can keep the door open for bearish short-term themes in the US Dollar, and this could be sought out through the bullish setup investigated above in EUR/USD. For those that would like to get on the side of long-USD, a break back above the 95.00 level could make those prospects look considerably more attractive.
US DOLLAR HOURLY PRICE CHART: BOUNCE FROM AUGUST LOWS TESTING RESISTANCE AT PRIOR SUPPORT
US DOLLAR – 95.00 A KEY LEVEL FOR TODAY
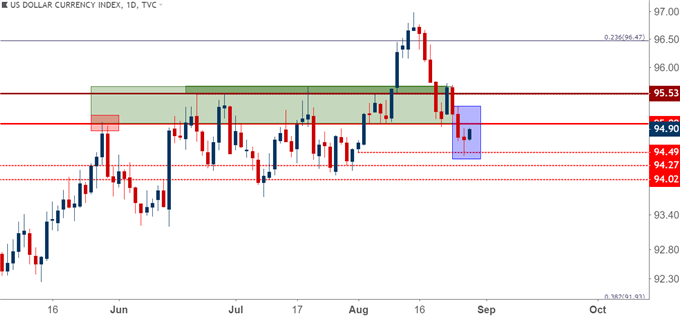
On the Daily Chart of the US Dollar, yesterday produced a spinning top formation, which is like a doji but with a slightly wider body. Like a doji, this formation signals indecision and will often show near the top or bottom of a move. Given the strength that’s shown so far today, this produces a potential morning star formation should today’s candle close above the 95.00 level, which would produce the dual-pronged benefit of completing the formation while also mounting back-above a key area on the chart. This could make the theme of bullish continuation in the US Dollar look more attractive, thereby speaking to the bearish EUR/USD scenario looked at above.
US DOLLAR DAILY PRICE CHART: BULLISH MORNING STAR POTENTIAL WITH CLOSE OVER 95.00
GBP/USD DEEPER INTO THE WEDGE
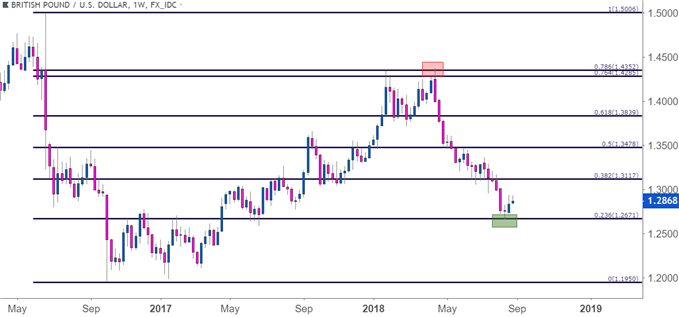
GBP/USD has finally found some element of support after the four-month bearish trend pushed prices to fresh lows. While GBP/USD topped out at the 78.6% Fibonacci retracement of the Brexit move in April, so far it’s been the 23.6% retracement of that same move that’s helped to quell the declines.
GBP/USD WEEKLY PRICE CHART: FIBONACCI SUPPORT HOLDS THE LOWS, FOR NOW
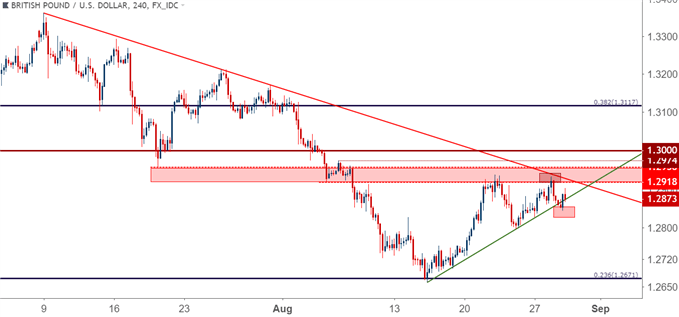
Since that support came into play two weeks ago, prices have been working higher, and the trend-line that’s built underneath price action can be coupled with a longer-term bearish trend-line to produce a symmetrical wedge formation; which indicates digestion after a really big directional move.
GBP/USD FOUR-HOUR PRICE CHART: TESTING WEDGE SUPPORT AFTER HOLD OF LOWER-HIGH RESISTANCE
AUD/USD BACKS DOWN - .7200 RE-TEST IN STORE?
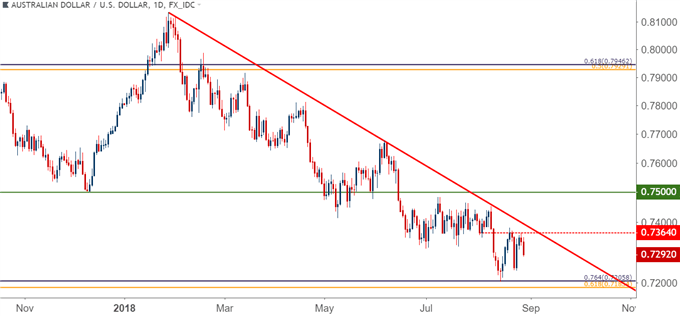
Last week we looked at counter-trend plays in AUD/USD, largely on the basis of the pair running into a big area of confluent Fibonacci support. This is the same area that turned around two separate bearish advances in 2016, and hadn’t come back into play since.
But last week’s bullish advance stopped short of a trend-line re-test, and over the past week we’ve seen lower-high resistance build: We looked at this setup in yesterday’s webinar as an interesting level of resistance was holding the highs around the level of .7364. Since then, we’ve seen reaction and prices are now heading back-down, giving the appearance of a possible re-test of the .7205 Fibonacci level on the charts.
AUD/USD DAILY PRICE CHART
VERIFY YOUR ACCOUNT AND GET YOUR $30 INSTANTLY ,MAKE MONEY WITHDRAW !!
IT IS POSSIBLE TO SHIFT FROM $30 TO $1,000,000 TRY TODAY
IF YOU FACE ANY PROBLEM TO GET THIS OFFER PLEASE CONTACT US FOR
SUPPORT , CLICK SMS BAR ABOVE THEN TALK TO US


Comments
Post a Comment