US Dollar Breakout Finds Fibonacci Resistance, Can Bulls Push Ahead?
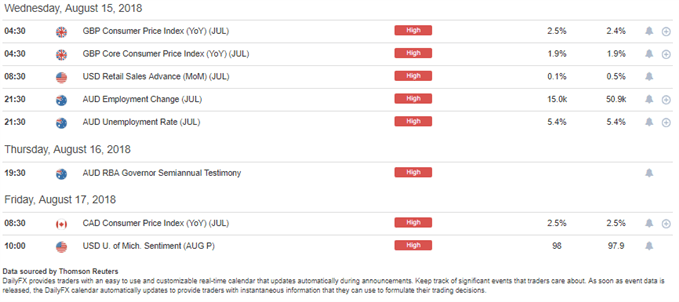
-IMPACT ITEMS REMAINING FOR THIS WEEK (TIMES IN ET)
BRITISH POUND REMAINS WEAK AND OVERSOLD AHEAD OF UK INFLATION
It’s been another brutal month for the British Pound, extending a rough four-month patch in the currency as inflation has continued to soften in the economy. After watching inflation run above 3% for five consecutive months to close 2017 and open 2018, the Bank of England warned of potential rate hikes at their ‘Super Thursday’ rate decision in February. Given that the bank has been reticent to make moves at non-Super Thursday rate decisions, this circled the meeting in May as the next probable area for a rate hike.
But before we got to that rate decision, inflation started to turn-lower in mid-April, and the BoE backed away from tighter policy at that meeting and GBP/USD dug into support around 1.3500. After that we had another flare of Brexit risk and this sent the Pound even-lower. A flicker of strength began to show in mid-July as rumors began to circulate that the BoE may be more-hawkish than expected, largely on the basis of still-elevated inflation figures. Markets were fully expecting a 25 basis point rate hike, but there remained a great deal of uncertainty around what happens after.
The Bank of England took a very dovish outlook to markets at the August rate decision, and despite the fact that the bank hiked rates for only the second time in the past decade, the British Pound started to fall, and didn’t really stop until we came into this week. Yesterday produced a Doji on the Daily Chart, and so far this morning that support appears to be holding.
GBP/USD WEEKLY PRICE CHART: OVERSOLD RSI FOR FIRST TIME SINCE POST-FLASH CRASH (OCT, 2016)
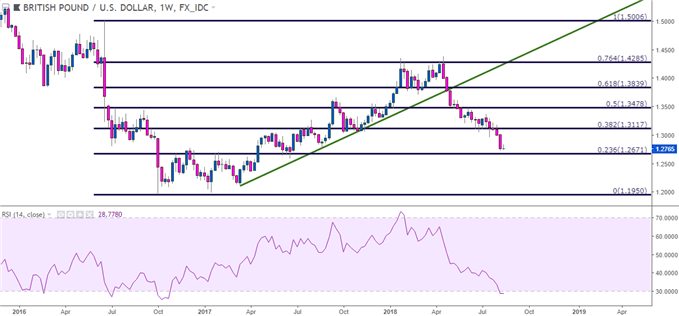
We discussed this theme at greater length in yesterday’s technical article on GBP/USD entitled, GBP/USD: Cable Attempts to Carve Out Support, But Can it Hold?
In the article we looked at the oversold nature of the setup at the moment, and urged caution towards chasing the move-lower while prices were holding support at yearly lows. This doesn’t necessarily obviate the bearish stance, however, as a blip of strength in the pair around tomorrow’s inflation release can bring prices to a more attractive area of resistance, at which point bearish continuation strategies can come into focus again.
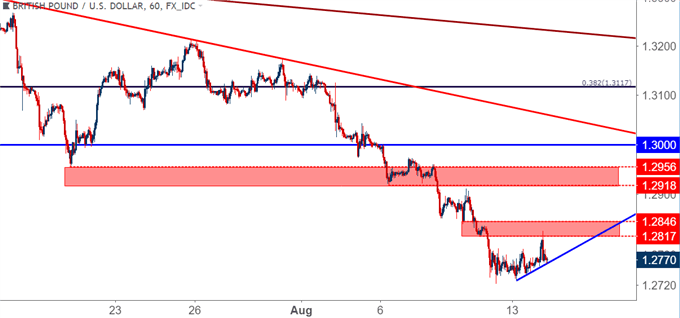
Below, we look at two potential areas of resistance below the 1.3000 psychological levelin GBP/USD, the first of which has already come into play with a 50+ pip resistance reaction earlier this morning. If prices don’t print down to fresh lows after that first area of resistance, then the door is open for a move up to the second area of resistance that runs from 1.2918-1.2956.
GBP/USD HOURLY PRICE CHART: LOWER-HIGH RESISTANCE POTENTIAL FOR BEARISH CONTINUATION
EURO BEARS KEEP THE PRESSURE ON
Last week saw another wave of weakness in the single currency as fears around contagion continued to grow. The big point of concern appears to be Spanish banks, who are carrying €80 Billion-plus of exposure to Turkish banks. And given the tight trading relationships within the Euro Zone and particularly European banks, who have been beset by low-to-negative rate regimes over the past five years, there appears to be vulnerability shared throughout the European banking sector.
EUR/USD DAILY PRICE CHART: BREAKDOWN TO FRESH YEARLY LOWS LAST WEEK
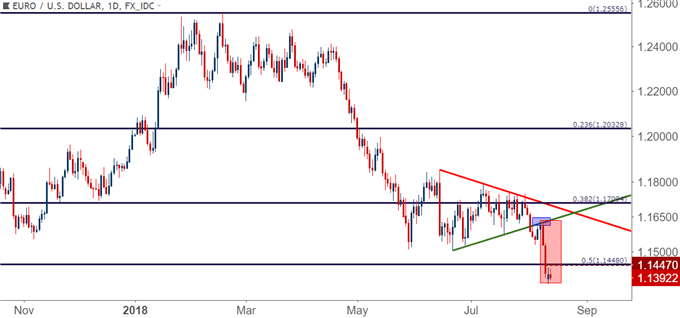
This concern pushed EUR/USD down to fresh lows last week and the selling remained intense into the close. This week, prices gapped-down but have since been trading back-and-forth as support has dug-in around the 1.1365 area on the chart. Bears have remained active, continuing to sell off of short-term resistance around the 1.1425 level.
EUR/USD HOURLY PRICE CHART: SHORT-TERM RANGE BUILDS NEAR FRESH YEARLY LOWS
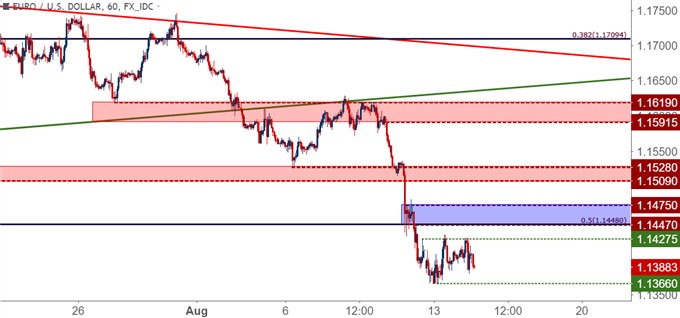
We looked into the pair as part of our FX Setups for this week, looking for the pair to work up to lower-high resistance which can open the door for bearish continuation strategies. Those potential resistance areas have yet to come into play, and this remains a workable theme as we trade deeper into this week.
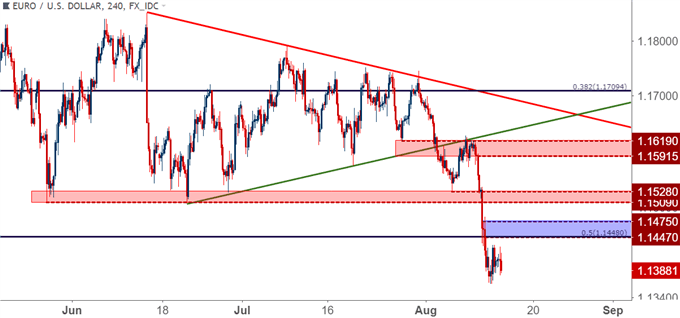
EUR/USD FOUR-HOUR PRICE CHART
Start Trading with Free $30 : CLAIM NOW $30
VERIFY YOUR ACCOUNT AND GET YOUR $30 INSTANTLY ,MAKE MONEY WITHDRAW !!
IT IS POSSIBLE TO SHIFT FROM $30 TO $1,000,000 TRY TODAY
IF YOU FACE ANY PROBLEM TO GET THIS OFFER PLEASE CONTACT US FOR
SUPPORT , CLICK SMS BAR ABOVE THEN TALK TO US.


Comments
Post a Comment