US Dollar Digestion Comes Back Ahead of US Inflation
Talking Points:
- Digestion is back in the FX market after last week’s bullish extension in the US Dollar. DXY is now showing lower-highs on short-term charts to go along with that 95.00 area of support; and this runs counter to the longer-term formation that’s seen two-plus months of resistance from 95.53 combined with the bullish trend-line that’s been building since mid-June.
- Tomorrow brings inflation data out of the United States for the month of July, and this data point has been on a strong run of recent as we go into tomorrow’s report following five consecutive months of gains, and ten straight months of inflation at the Fed’s 2% target or higher. The expectation for tomorrow is another print of 2.9%, just as we saw last month. This is a positive in that it reflects continued strength in the US economy, but it’s a negative in the fact that this wipes away all of the wage gains that have shown in the US of recent, and then some. The Fed will likely need to continue hiking to tame inflation closer to target, but will there be any softening in their hawkish stance as real wage growth nears flat-to-negative levels?
- DailyFX Forecasts on a variety of currencies such as the US Dollar or the Euro are available from the DailyFX Trading Guides page. If you’re looking to improve your trading approach, check out Traits of Successful Traders. And if you’re looking for an introductory primer to the Forex market, check out our New to FX Guide.
US DOLLAR DIGESTION COMES BACK AFTER LAST WEEK’S BREAKOUT
The US Dollar has settled throughout this week after opening with strength. After a failed attempt to take out the resistance that’s been building for the past two months, buyers showed up around the 95.00 level on DXY on Tuesday. After a quick bounce, prices returned to support yesterday and, again, bounced. But as we near that earlier-week swing highs, bulls have shown a tendency to step away from the bid, and the net result is a bit of digestion after last week’s topside burst. This sets the stage for the release of July inflation numbers out of the United States, on the economic calendar for tomorrow morning at 8:30 AM Eastern Time.
US DOLLAR HOURLY CHART: DIGESTION OF PRIOR WEEK’S BULLISH MOVE
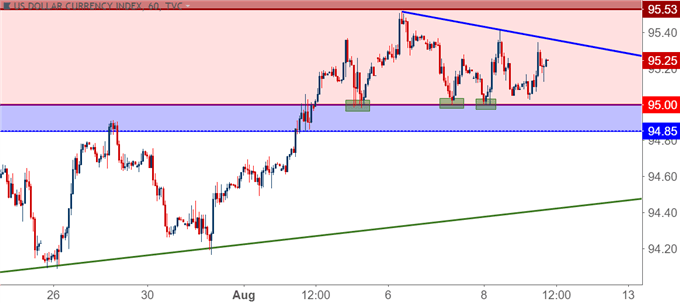
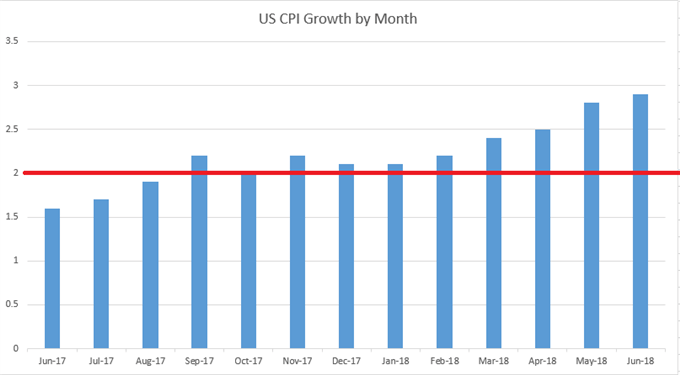
Tomorrow brings a key data point out of the US economy with the release of July CPI numbers. The expectation is for headline inflation to print at 2.9% for the second consecutive month, and last month’s print continued a trend of a now five consecutive months of stronger inflation. This also marked ten consecutive months of inflation at-or-above the Fed’s 2% target, keeping the bank in the driver’s seat for another two rate hikes in 2018. While this is a positive in that it reflects continued strength in the US economy, it does also bring about the question of real wage growth. The NFP report issued earlier this month reflected wage gains of 2.7%, which doesn’t quite keep pace with the 2.9% from June nor the 2.9% CPI-growth that we’re expecting for July.
US INFLATION: TEN MONTHS AT-OR-ABOVE 2%, FIVE STRAIGHT MONTHS OF GROWTH – WILL IT CONTINUE?
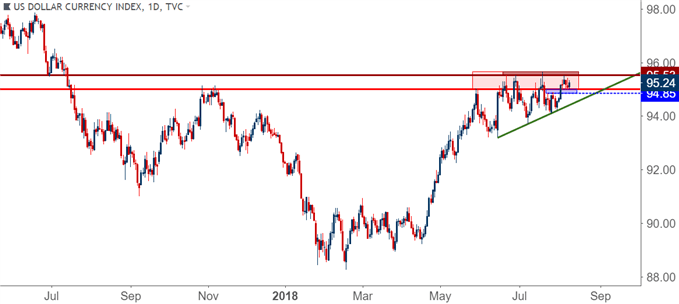
The big question around tomorrow’s inflation data is whether this gives USD bulls the motivation that they need to continue this topside move up to fresh yearly highs. Since mid-June, bulls have been getting more aggressive on tests of support, as indicated by the rising trend-line that’s showed over the past couple of months. But on the resistance side – matters have stayed fairly consistent as buyers have continued to fall back around the 95.53 level, giving us an ascending triangle formation. These will normally be followed in the direction of the recent bias, in this case bullish, as that horizontal resistance is finally taken-out by more aggressive buyers that have been continually responding at higher-lows. This does not, however, denote the element of timing as we may be in for another support tests before bulls finally have the push they need to leave resistance behind.
US DOLLAR DAILY PRICE CHART: ASCENDING TRIANGLE FACES JULY INFLATION DATA
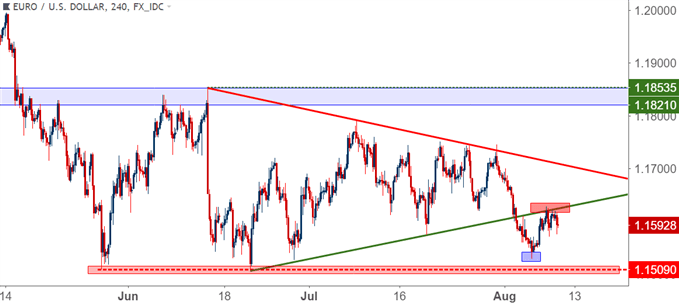
EUR/USD FINDS RESISTANCE AT PRIOR SUPPORT – CAN BEARS ELICIT ANOTHER 1.1509 TEST?
We looked at this theme yesterday: EUR/USD broke below the symmetrical triangle that’s been building for the past couple of months earlier this week. But – bears shied away before we could move down to re-test that prior swing-low at 1.1509, and this adds a bit of complication to the setup as bearish continuation appears a bit less attractive given yet another failure from sellers to bring upon a test below the 1.1500 handle.
But – that failed run at 1.1500 has now brought upon a pullback, and that pullback ran all the way until a bit of resistance began to show at prior support. This could keep the doors open for bears as we move towards tomorrow’s inflation report.
EUR/USD FOUR-HOUR PRICE CHART: RESISTANCE AT PRIOR TREND-LINE SUPPORT
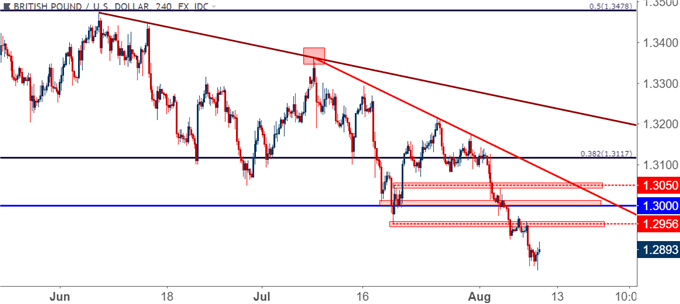
GBP/USD REMAINS OVERSOLD
The nasty sell-off in the British Pound appears to have finally found some element of support over the past 24 hours. This comes on the heels of a rather aggressive bearish move that started around the Bank of England’s rate hike last Thursday. With a brutal amount of uncertainty around Brexit now coupled with a Bank of England that’s not expected to hike rates anytime soon, it appears as though there’s very little reason for bulls to defend the bid.
Perhaps the most positive thing going for the British Pound and GBP/USD right now is just how incredibly weak it has been. We broke below 1.3000 to open this week and that sell-off has largely continued until we ran into yesterday’s support. This can open up the possibility of a bounce or perhaps even a mild short-squeeze type of scenario, particularly if the US Dollar pulls back below the 95.00 level on DXY.
We wrote about the pair in yesterday’s article entitled, GBP/USD: Cable Crushed Through 1.3000, More Pain in Store? We were looking for possible resistance points to stage strategies based upon continuation of the down-trend, and below, those same three levels are identified. If we have a break-above the 1.3117 Fibonacci level, then we’d also have a break of the shorter-term, more bearish trend-line.
GBP/USD FOUR-HOUR PRICE CHART: LOWER-HIGH RESISTANCE POTENTIAL
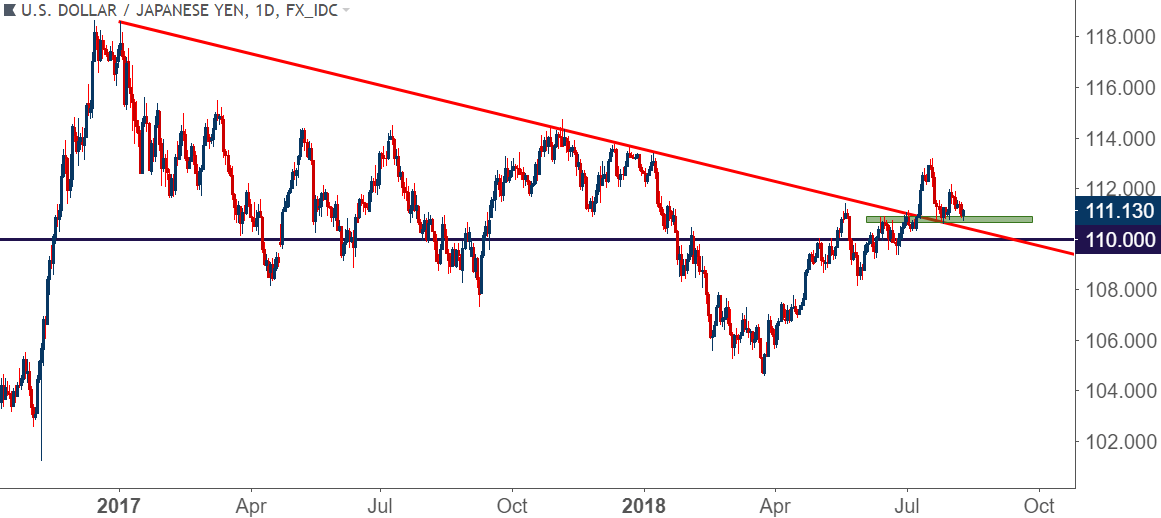
USD/JPY: BARRIERS TO ENTRY
We’ve been following the topside move in USD/JPY in Q3, as the pair started off the fresh quarter with a bang, breaking-above a bearish trend-line that had held the highs in USD/JPY since January of 2017. After a pullback and a quick check of support around this level in late-July, bulls took over again in early-August after the BoJ rate decision, but that push fell flat and prices reverted right back to support.
USD/JPY DAILY PRICE CHART: REVERT BACK TO SUPPORT AFTER EARLIER Q3 BREAKOUT
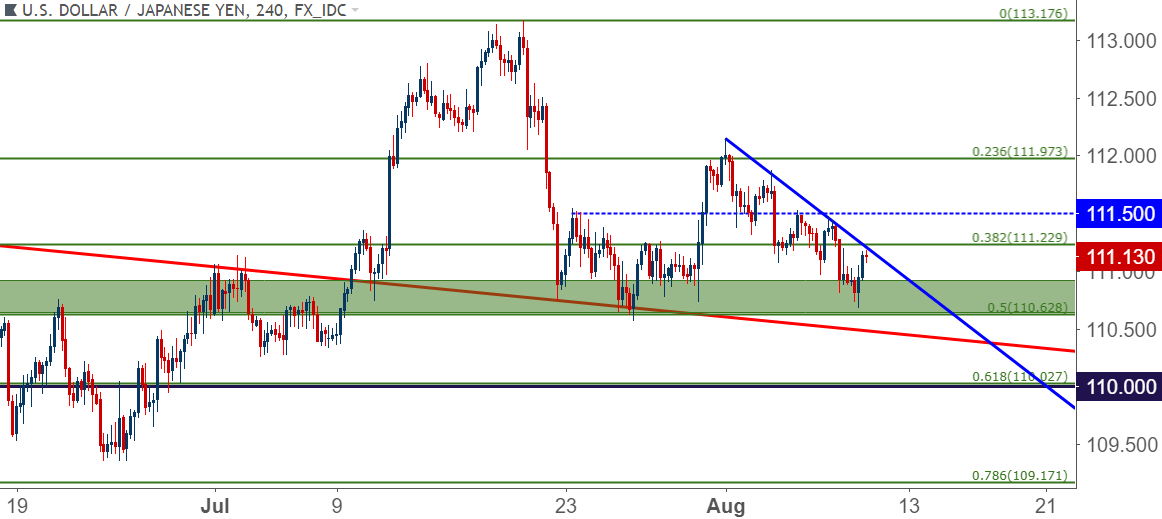
On a shorter-term chart, we can see where a descending trend-line has formed with August price action, and this can help to define bullish strategies as a topside break above this trend-line can help to show an early return of bulls. For those that want to be a bit more conservative on the matter, a test above the 111.50 area can open the door for bullish continuation, at which point the trader can then look for a higher-low before taking on exposure in the move.
USD/JPY FOUR-HOUR PRICE CHART: A DESCENDING TREND-LINE SHOWS ON AUGUST PRICE ACTION
Start Trading with Free $30 : CLAIM NOW $30
VERIFY YOUR ACCOUNT AND GET YOUR $30 INSTANTLY ,MAKE MONEY WITHDRAW !!
IT IS POSSIBLE TO SHIFT FROM $30 TO $1,000,000 TRY TODAY
IF YOU FACE ANY PROBLEM TO GET THIS OFFER PLEASE CONTACT US FOR
SUPPORT , CLICK SMS BAR ABOVE THEN TALK TO US.


Comments
Post a Comment