US Dollar Rallies, Gold Sinks to Support Ahead of Latest NFP Report
EURUSD AND GOLD – PRICES AND TECHNICAL ANALYSIS
- EURUSD nearing 1.1500 support zone.
- Gold continues to break lower on a strong dollar – weak Chines Yuan double.
US DOLLAR STRENGTH SEEN ACROSS THE MARKET
The US dollar continues to press higher and is within touching distance of a new one-year high, supported by US Treasury yields and expectations of a better-than expected US jobs report. The dollar index (DXY) currently trades at 94.88, up a full point in the last four days. Today’s US non-farm payrolls report is expected to show 192,000 new jobs created, pushing the unemployment rate down to 3.9% from 4.0%, confirming the ongoing strength of the US economy. Wednesday’s FOMC meeting underscored a third 0.25% rate hike this year, in September, with heightened expectations of another hike in December.
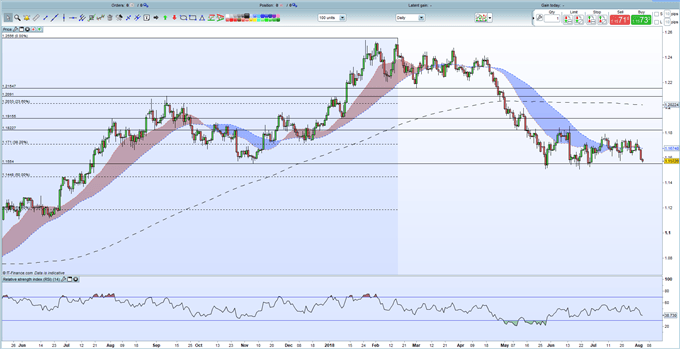
EURUSD continues to weaken and now nears the 1.1500 level that has provided support over the last two months. As monetary policy continues to diverge between the two economies – the ECB is not expected to hike rates until Q3 2019 – the pair have come under increasing selling pressure and now eye the 50% Fibonacci retracement level at 1.1448. The 1.1500 level may provide support again, if central banks are defending this level, with a break lower likely to attract the ire of Washington. US President Donald Trump has already complained about the lowly level of the EUR and how it affects the balance of trade between the two and he is likely to become vocal again if EURUSD falls further.
EURUSD DAILY PRICE CHART (MAY 2017 – AUGUST 3, 2018)
GOLD SINKS TO A ONE-YEAR LOW
Gold continues to falter in the face of a strong US dollar complex and a weaker Chinese Yuan. With US yields rising, the non-interest bearing precious metal continues to lose its appeal with recent risk-off bounces sold into. Gold is also at the mercy of US-China trade tensions with the Chinese Yuan continuing to weaken as US trade tariffs are imposed. The correlation between the two assets remains firm and is seen as one of the primary drivers of gold’s weakness. USDCNH is currently quoted at 6.8940, its highest level since May 2017 and up from 6.2500 in March this year.
In-depth primer on Yuan Depreciation and US–China Trade Wars
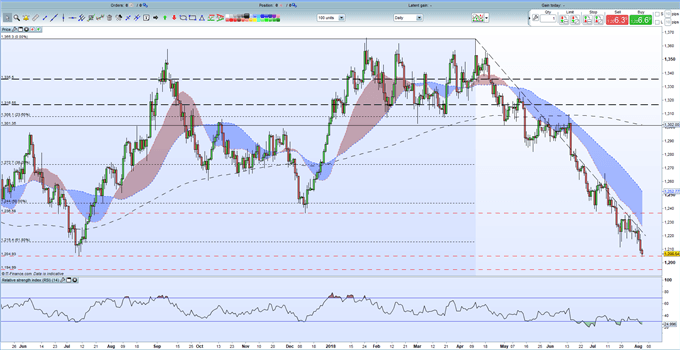
Gold is now sitting on important support just under $1,205/oz. and a break lower would see $1,194/oz. the March 2017 low come into play ahead of the January 2017 low at $1,180/oz. The precious metal is in oversold territory according to the RSI indicator which may act as a short-term buffer against further losses.
GOLD DAILY PRICE CHART (JUNE 2017 – AUGUST 3, 2018)
Start Trading with Free $30 : CLAIM NOW $30
VERIFY YOUR ACCOUNT AND GET YOUR $30 INSTANTLY ,MAKE MONEY WITHDRAW !!
IT IS POSSIBLE TO SHIFT FROM $30 TO $1,000,000 TRY TODAY
IF YOU FACE ANY PROBLEM TO GET THIS OFFER PLEASE CONTACT US FOR
SUPPORT , CLICK SMS BAR ABOVE THEN TALK TO US.


Comments
Post a Comment