XAU/USD Technical Outlook: Gold Prices Digest Recent Losses
- Gold prices testing fresh yearly lows- immediate focus is on consolidation above 1204
- Check out our new 3Q projections in our Free DailyFX Gold Trading Forecasts
- Join Michael for Live Weekly Strategy Webinars on Mondays at 12:30GMT
Gold is down nearly 7% year-to-date with price registering fresh yearly lows last week. Both price and momentum have been coiling up and the focus is on a breakout in the days ahead of guidance. Here are the updated targets and invalidation levels that matter for Gold. Review this week’s Strategy Webinar for an in-depth breakdown of this setup and more.
GOLD DAILY PRICE CHART
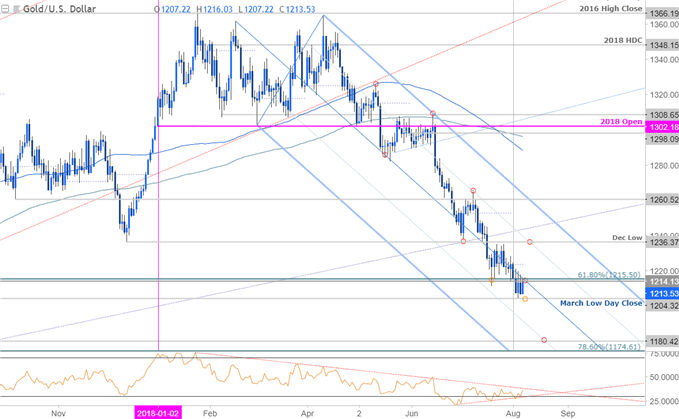
Technical Outlook: In last week’s Gold price forecast we highlighted that the, “threat of a near-term recovery remains evident while above the lower 50-line / 2017 March low-week close at ~1204.” Price registered a fresh yearly low at 1204 before rebounding with the weekly opening rangetaking shape just above this key threshold.
Interim resistance stands at 1215 backed by the monthly open at 1223. Broader bearish invalidation stands at 1236- a breach / close above this threshold would be needed to suggest a more significant low is in place. A break lower from here risks substantial losses for the yellow metal with such a scenario targeting the lower parallel (currently ~1190s), 1180 and the 78.6% retracement at 1175.
GOLD 240MIN PRICE CHART
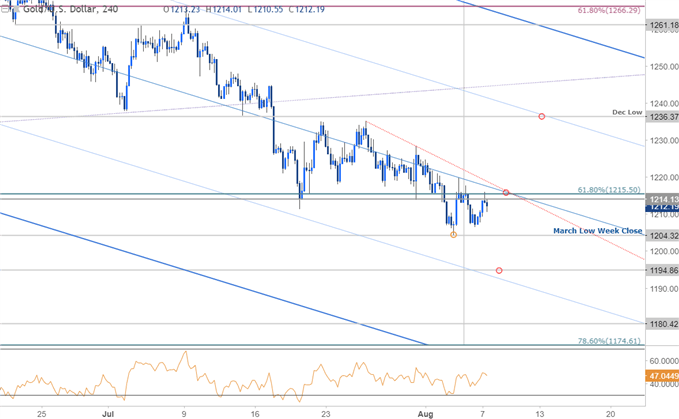
Notes:A closer look at price action sees gold trading just below the median-line of the broad descending pitchfork formation we’ve been tracking off the February / April highs. A breach above this slope would help alleviate further downside pressure. Note that intraday RSI has not broken above 60 since early July- look for a change in behavior. A break lower eyes initial support objectives at 1194 backed by 1175/80.
Bottom line: IF gold prices are going to rebound, this is a good spot to look. The broader short-bias remains vulnerable near-term while above 1204- look for a break of the weekly opening range for guidance with a breach 1215 targeting the December lows / upper parallel at 1236. From a trading standpoint, I’m looking for signs of exhaustion down here – I’ll favor fading weakness into 1204 / buying a break & retest of slope resistance as support. That said, respect a downside break – this is a pretty big pivot in price for Gold. Stay nimble here- with all the Trade War headlines circulating and trader sentiment pulling back from recent extremes, this contracting range in gold is likely to give way to a larger leg in the days ahead.
GOLD TRADER SENTIMENT
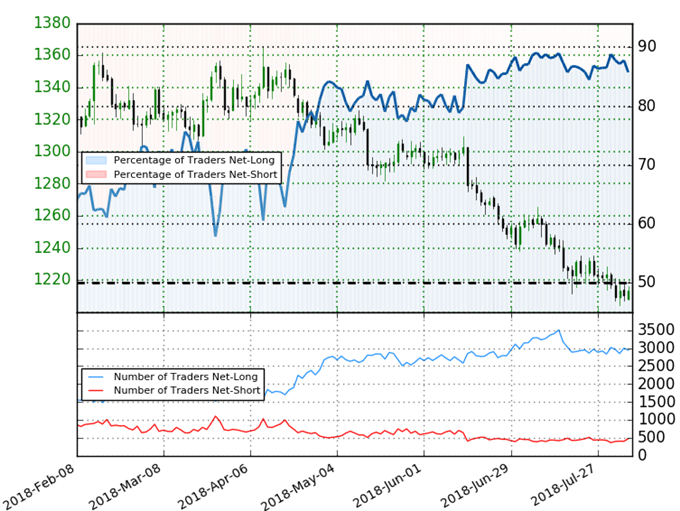
- A summary of IG Client Sentiment shows traders are net-long Spot Gold - the ratio stands at +6.02 (85.8% of traders are long) – bearish reading
- Long positions are1.5% higher than yesterday and 2.3% lower from last week
- Short positions are 7.2% higher than yesterday and 10.9% higher from last week
- We typically take a contrarian view to crowd sentiment, and the fact traders are net-long suggests Spot Gold prices may continue to fall. Yet traders are less net-long than yesterday and compared with last week. Recent changes in sentiment warn that the current Gold price trend may soon reverse higher despite the fact traders remain net-long.
Start Trading with Free $30 : CLAIM NOW $30
VERIFY YOUR ACCOUNT AND GET YOUR $30 INSTANTLY ,MAKE MONEY WITHDRAW !!
IT IS POSSIBLE TO SHIFT FROM $30 TO $1,000,000 TRY TODAY
IF YOU FACE ANY PROBLEM TO GET THIS OFFER PLEASE CONTACT US FOR
SUPPORT , CLICK SMS BAR ABOVE THEN TALK TO US.


Comments
Post a Comment